🌱 Dive into Learning-Rich Sundays Monday with groCTO ⤵️
I know we are late this time but trust me we were cooking something special for you. Buckle up for the 2024 DORA report edition!
To honor the 2024 DORA report, this week’s featured sections are devoted to three key areas of analysis from the report.
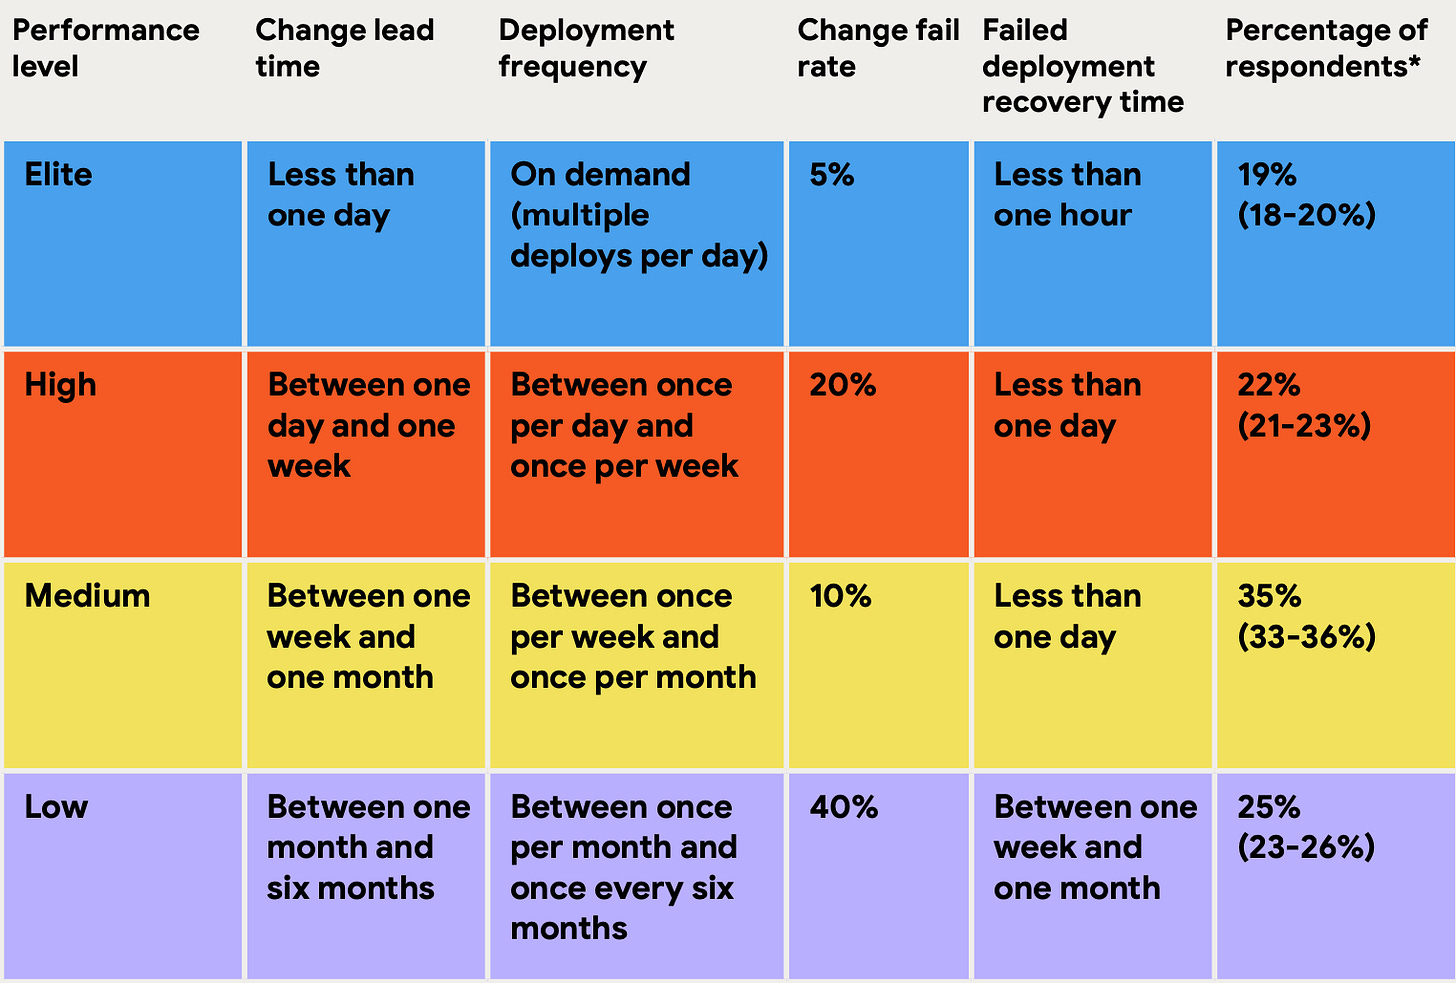
“When compared to low performers, elite performers realise 127x faster lead time and 182x more deployments per year.” —2024 DORA Report
The Big Wins
A quick note before jumping into comparison! The DORA Research data is aimed at giving you intuition and a baseline sense of what is possible to inspire you in your own experiments and improvements.
It is in no way meant to provide an industry standard or apples-to-apples data to compare with your own team’s measurements.
“The best teams are those that achieve elite improvement, not necessarily elite performance.”
No significant changes from last year. The percentage of respondents column was added to give an estimated sense of how many surveyed organizations fall into each category.
Continuous, on-demand delivery of changes at a high level of quality continues to be the main focus for elite performers while maintaining a sustainable pace of work with user-centric value streams and transformational leadership to improve employee well-being and offset burnout.
From our Sponsors- Typo AI
The only software engineering intelligence platform that brings together DORA metrics, AI code reviews, & dev insights to deliver software faster, better, and more predictably.
If you are someone implementing DORA (or other engineering metrics framework) to improve engineering productivity- Try Typo AI
Crazy! AI Adoption
Last year’s report highlighted the overwhelmingly positive impact of generative cultures, user centrism, continuous delivery and improved code reviews on burnout and team performance.
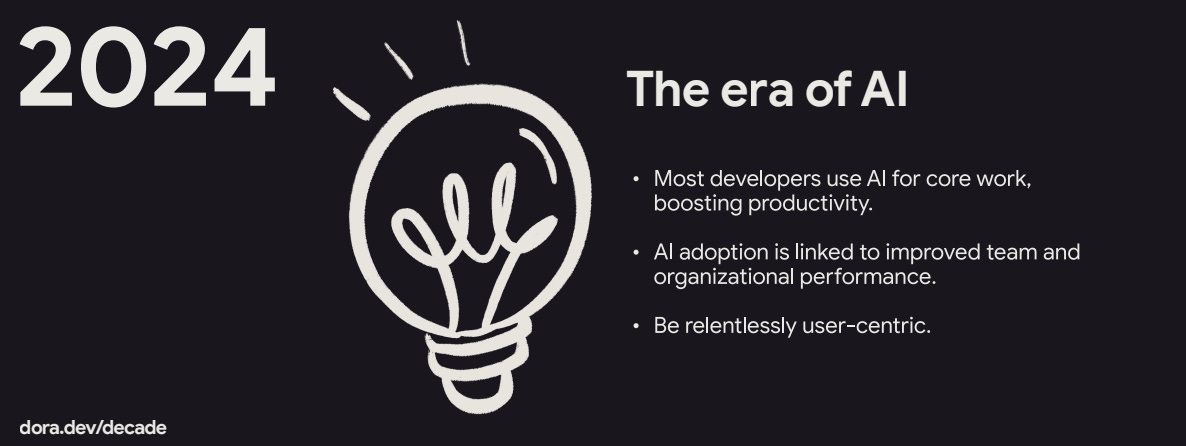
This year the focus on user centrism remains stable, while also being augmented by a huge surge towards AI and transformational leadership.
AI is seemingly in every part of the creation process, from planning, engineering management to visualisations and coding.
Here are the top uses cases that were reported for significant usage and adoption, albeit with inconclusive impact on overall productivity:
Writing Code, autocomplete and optimisations
Explaining legacy parts of the codebase
Summarizing information, documentation and data analysis
Writing tests, debugging
Further surveys show increased AI adoption having a positive impact on productivity, flow and job satisfaction. Though its impact is nowhere near the four key metrics. If you know that lack of tests or user centric / on-demand delivery of changes is the main thing holding you back then focusing on stability and throughput are likely your main avenues of improvement, despite the AI trends.
Trust in AI and Productivity
Most users of AI tools report a mild-to-no increase to their productivity while remaining constantly sceptical of the accuracy and trust that goes into genAI generated outputs.
However, a silver lining in all the data is that relatively no reports have been made about decreases in individual productivity. We highlight individual as there have been reports of AI-generated code increases batch sizes, where it is shown to lead to slower delivery performance (frequency and lead time).
But overall this is good news for continued AI adoption and experimentation in your every day product engineering workflows.
Bottom Line
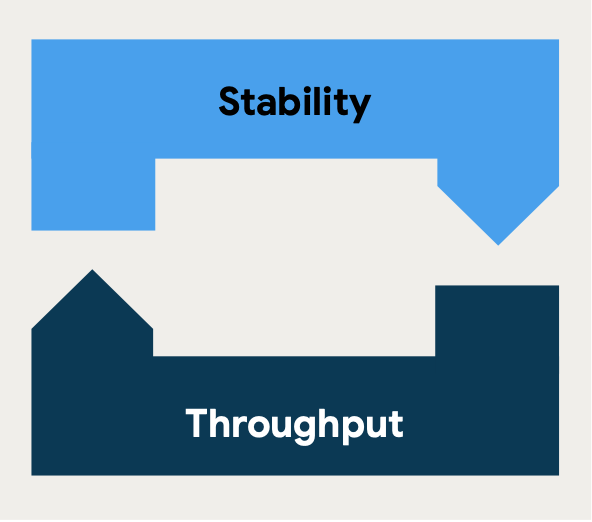
Speed and quality are not mutually exclusive. Research shows the iron triangle does not hold true for software delivery in the manner that a naïve observer may find intuitive.
The DORA Research data continues to prove that teams do not need to sacrifice speed for stability. “You have to go fast to improve quality, and improving quality will help you deliver faster,” to paraphrase Dave Farley from our recent webinar, the prominent continuous delivery thought leader and author.
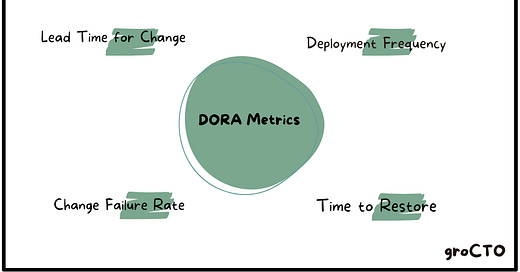
The four key metrics are shown to relate well with each other as high-performing organisations excel across all four areas with an overlapping, positive feedback loop.
Four Key Metrics
Change lead time: Time from commit to deploy.
Deployment frequency: How often changes are deployed.
Change fail rate: Percentage of deployed changes that result in end-user disruption.
Failed deployment* recovery time: Time to fix end-user disruption
*when it resulted from a deployed code change that requires another deployment to resolve
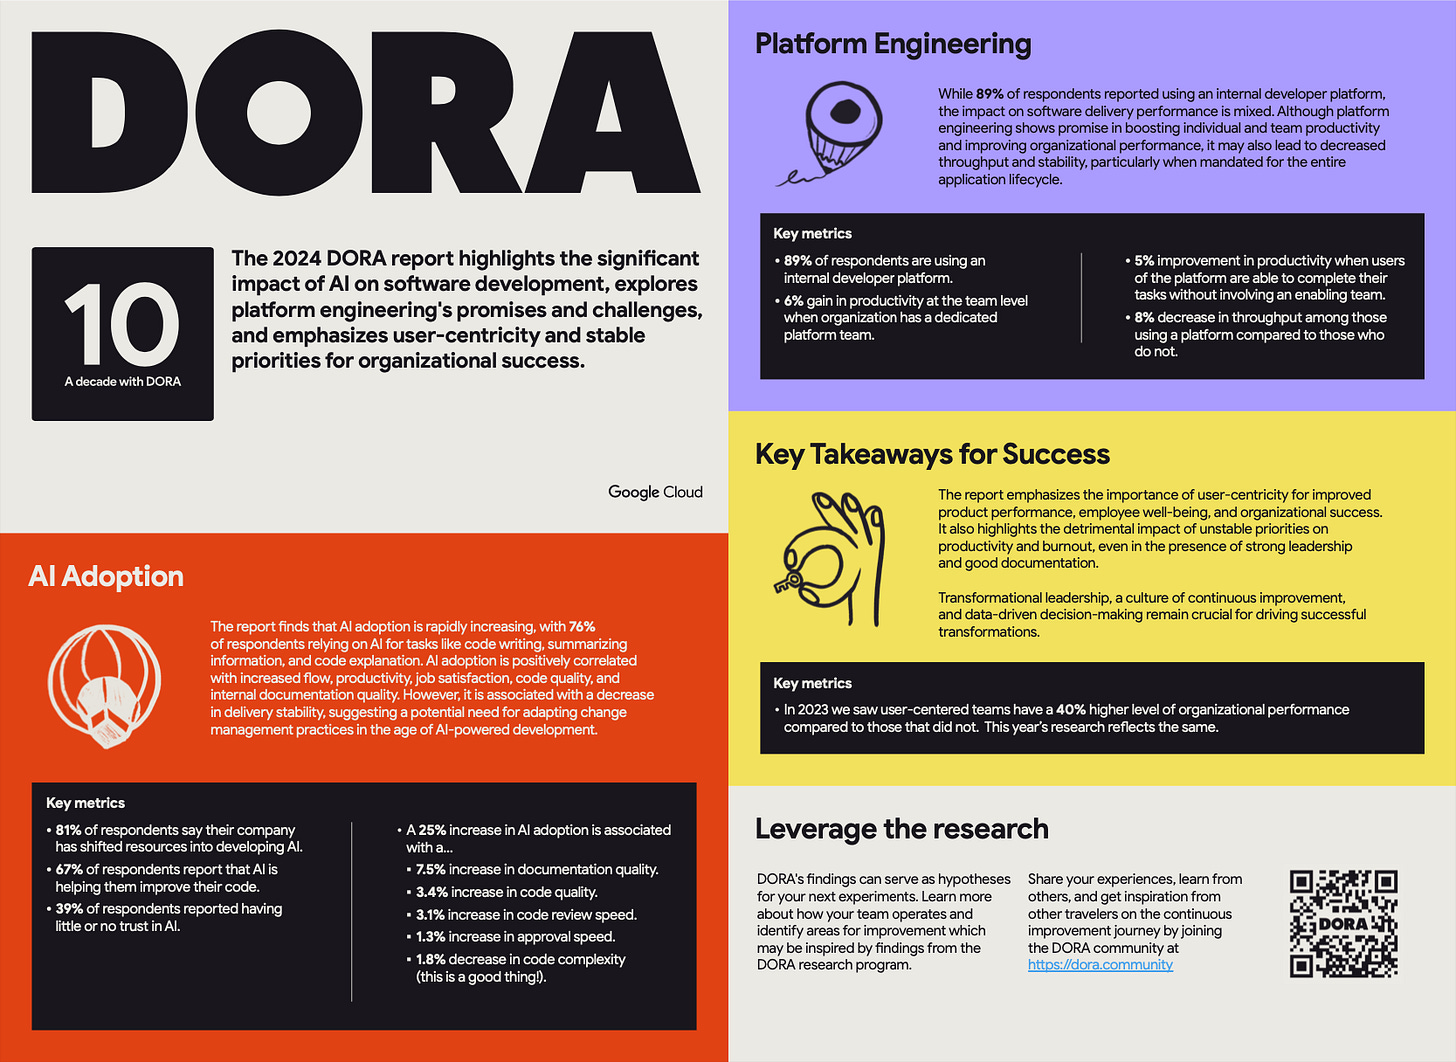
TL;DR For Your Executive Team
Additional Links
Credits 🙏
Curators - Diligently curated by our community members Denis & Kovid
Special Thanks to the Report Authors - Amanda Lewis, Kevin M. Storer, Derek DeBellis, Benjamin Good, Daniella Villalba, Eric Maxwell, Kim Castillo, Michelle Irvine, Nathen Harvey and others.
Sponsors - This newsletter is sponsored by Typo AI - Ship reliable software faster.
1) Subscribe — If you aren’t already, consider becoming a groCTO subscriber.
2) Share — Spread the word amongst fellow Engineering Leaders and CTOs! Your referral empowers & builds our groCTO community.


